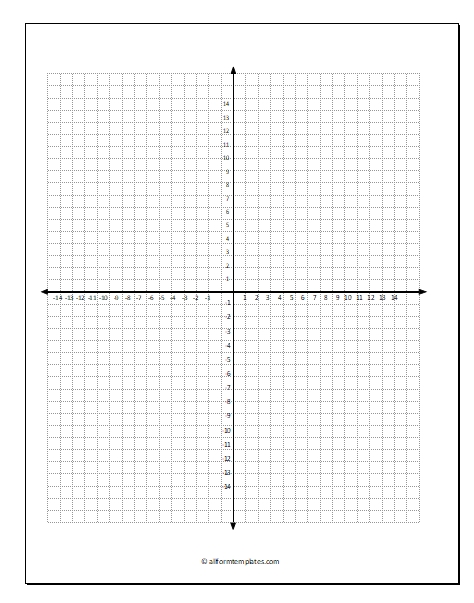
Graph paper is commonly also known as graphing, grid or millimeter paper. It is a writing paper that has fine lines arranged in a regular grid pattern which serves as a guide for drawing, sketching or plotting functions. It can be used for many other purposes, Mathematics and Engineering are among them but it can be used in your daily life as well.
While drawing a statistical chart, planning a craft project or renovating home. We are most familiar with the grid version but it is available in many types depending on its use.
- The logarithmic graphing paper consists of rectangles drawn in varying widths corresponding to logarithmic scales for semi-log graphs.
- The isometric paper consists of a grid of small triangles that is mostly used to simulate an isometric view or to help in the design of triangle point embroidery.
- Hexagonal ones use regular hexagons instead of squares.
Buying graph paper is not a problem but it is also possible to generate one as per your specifications, with the parameters of your choice.
When it comes to design, especially within the engineering field, it is important to remember that having exact measurements can make all of the difference between a wonderful design and a failed image. For dimensions to be accurate to whatever you are designing, with the hope that this design will eventually be recreated intangible formatting, it is of the utmost importance that you have the proper graphing and formatting paper. This will ensure that all of your dimensions line up so that you can create an object that can be appropriately assembled. Most of the designers may be in the habit of creating their own graph paper templates by hand. They utilize some of the pre-established templates to form a new one and this process saves a great deal of time. Ultimately, generating a graph paper template online will help you kick start the design process and ensure that your product is designed to the appropriate dimensions.
There are certainly a number of benefits associated with using online grid paper templates. If you are someone that likes things to be completed accurately and in a timely manner, then utilizing such graphing templates as it may be the best option for you to complete all of your tasks.
What is Grid Paper?
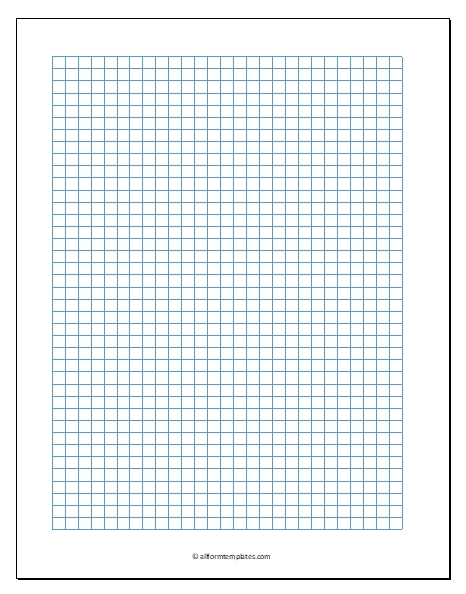
Grid paper is simply a page covered with a continuous square grid which is often called as “quadrille paper” or “quad paper.” The squares usually have a specific size such as 1/2 inch, 1/4 inch or 1/8 inch – which gives the paper a name such as “1/2 Inch Grid Paper.” No axis is drawn on grid paper. This type of paper is often used by the student for graphing assignments where they need to determine the scale by drawing the axis.
Grid paper is the type of graph paper that is most often used for art and drawing projects. It is used for creating floor plans, designing web pages, creating cross-stitch patterns, planning construction projects and many other purposes. Many people who use it believe that a quick pencil and paper sketch can be created in a fraction of the time required to make the same sketch with a computer program. This works well for a single draft, but if multiple refining drafts are required, then the computer program begins to have an advantage.
What is the different types of Printable Graph and Grid Paper?
Graph or grid paper can be used for multiple purposes, some of them are graphing, mapping, counting, multiplying, adding, and measuring. This can be achieved using the different formats of Grid Paper as per your requirement.
Single Line Graph Paper: The Measured graph/grid paper can be used in a variety of math learning situations. It is commonly used by people who work on the Metric system or those who want things measured using the Metric system. The gray lined paper is most useful if you need to draw over top of the existing lines and highlight your own figures.
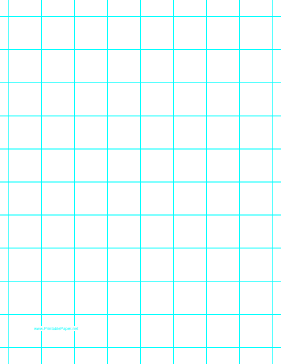
S. graph paper (Letter Size): This paper uses fractions of inches for those who are used to measuring using the U.S. or Imperial system of measurement. Perhaps you might consider using this graph paper for learning multiplication facts. To multiply 5 by 6, for example, a student would make a rectangle that is five squares by six squares and find out how many squares were contained within. You might also solve a problem like the following using grid paper, “Find the area of forest on a rectangular property that is 9 miles by 7 miles if the entire property is forested except for an estate with a house and open area that is 3 miles by 2 miles.”
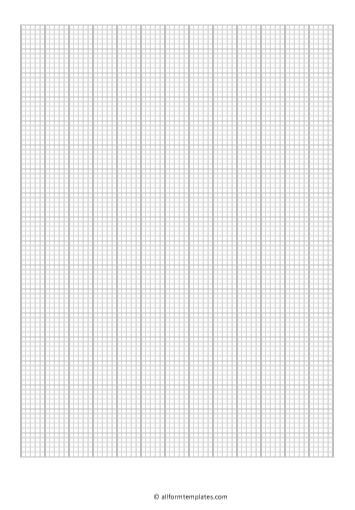
Multi-Line Graph Paper: Multi-line graph paper is graph paper that includes more than one measurement interval which is indicated by different colors and weights of lines.Multi-line graph paper has many applications including everything that you can accomplish on single-line graph paper.
A three-line graph paper worksheet with 2.5 cm, 1.25 cm, and 0.25 cm lines ends up having smaller boxes of 25 squares and larger boxes of 100 squares. There are also small rows and columns of 5 squares. This is very similar to the decimal money system that is used in many countries. Therefore, you could model counting coins using this particular three-line graph paper. The boxes of 25 and 100 and the rows and columns of 5 make it easy to get a total in the end.
Multi-line graph paper also makes most graphing activities easier because students can skip count rather than having to count each line.
For example drawing a bar on a bar graph that required a height of 28 would be easier if you had every 4 lines marked with a thicker differently colored line just like you’ll find on the two line graph paper with 1-inch major lines and 1/4 inch minor lines.
Coordinate Grid Paper: Coordinate grid paper or Cartesian grid or plain paper is used for plotting points in four quadrants on a coordinate plane. It can also be used for transformations that involve more than one quadrant. Many people use it for “Cartesian Art” where students plot points in a given order and join each point to the previous one with a line segment. There are many other uses for coordinate grid paper, limited only by your imagination.Cartesian graph paper is the most popular form of graph paper. This type of graph paper is identified by its two perpendicular set of lines which join to form a square grid.
Check here for Multiplication Table Chart for kids and Roman Numerals
The Cartesian graph paper’s grid is used when graphing or plotting two-dimensional equations. The other uses of this versatile graph paper include its use for sketches, craft projects, layouts and other non-math activities.
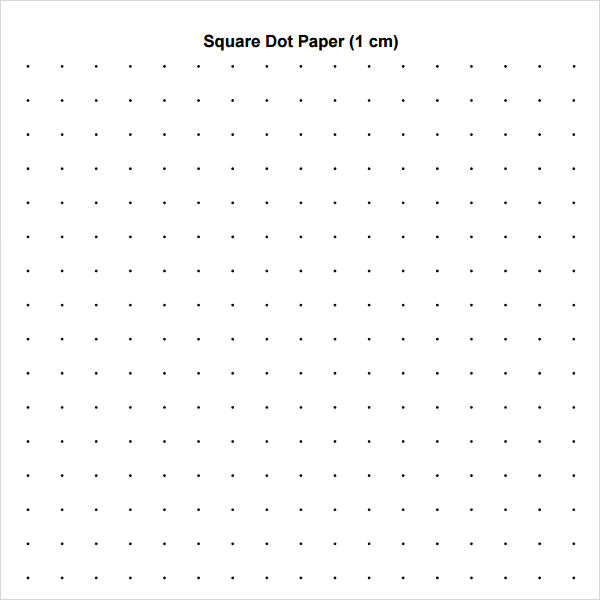
Square Dot Paper: Measured dot paper for use in a variety of math learning situations where a square arrangement of dots is needed.
Dot paper can be useful in a variety of mathematical situations.
For example:It is quite useful for drawing side views of connecting cube structures or other rectangular based figures. One very interesting use of dot paper is to find the area of irregular polygons using Pick’s Formula (named after George Alexander Pick). Here you can decompose an irregular polygon into regular polygons, find the area of each polygon and add the areas, or you could use the much easier Pick’s Formula which is to add the number of interior dots to half of the boundary dots and subtract one.
Dot paper can actually be used for just about anything for which grid paper can be used. Dot paper is grid paper without the line segments in between the vertices. Some people prefer dot paper as the page is less busy and allows better definition of anything that is drawn on the page.
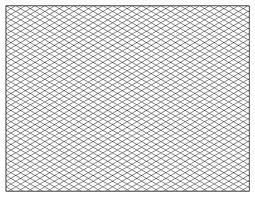
Isometric Paper: Isometric dot paper finds its use for sketching three-dimensional cube structures and other uses.With a little shading, the structures can look quite nice, unlike square grid paper. There is an up and down on isometric paper, so there are two choices for orientation: portrait or landscape.
Why we need a Printable Graph and Grid Paper?
Graph paper, coordinate paper, grid paper, or squared paper is a writing paper that consists of fine lines which join together to make up a regular grid. These lines are used as guides for plotting mathematical functions or experimental data and drawing two-dimensional graphs. It is commonly found in mathematics and engineering education settings and in laboratory notebooks. Graph paper is available either as loose leaf paper or bound in notebooks.It is used for plotting mathematical functions, plotting experimental data, or drawing designs and diagrams. It is commonly used in math, engineering, science, and art classes and sometimes in daily household work. Graph paper is known by a variety of other names which include “graphing paper,” “grid paper,” and “axis paper.”
Requirement of the Graph Paper or Grid Paper
Graph Paper: Disappearing from Stores: The sale of graph paper provided a substantial business for many printing and office supply companies during the 19th and 20th centuries. The growing demand and use of graph paper had been providing food for multiple homes.
Since the invention of the personal computer, the amount of graph paper demand has steadily declined. Spreadsheet programs automatically create graphs from collections of data.
The decline in demand for graph paper in the recent years, after the advent of desktops,has been so severe that many companies have stopped producing it, and many office supply stores now carry a selection that might be limited to grid paper and axis paper. Specially graph papers such as isometric paper, polar coordinate paper, and ternary diagram paper are nearly impossible to find in a store.
Graph Paper in Education: Although the use of graph paper is declining, many math teachers still make assignments that require students to graph, plan, and draw by hand – especially in introductory courses. This experience helps students to become thoroughly familiar with the concept of graphing before they begin producing graphs with a computer. These teachers believe that the time devoted to manual graphing assignments produces a higher level of student learning and understanding.
Cartesian graph paper is the most popular form of graph paper. This type of graph paper is identified by its two perpendicular set of lines which join to form a square grid.
The Cartesian graph paper’s grid is used when graphing or plotting two-dimensional equations. The other uses of this versatile graph paper include its use for sketches, craft projects, layouts and other non-math activities.
Uses of Graph/Grid paper
Graph paper is paper meant to be written and drawn on that is made of up fine lines arranged vertically and horizontally as to create many small boxes. It is useful when you want to draw things to some kind of scale, instead of measuring each line with a ruler while the graph paper serves as a guide.
Graph paper is available in many different measurements depending on your requirement.
For example:
- Each box can be a centimeter or an inch in length.
- The Cartesian system can make use of graph paper since it makes graph paper ideal for taking notes in math related subjects. For example to plot and study lines, functions, and data.
Other uses of graph paper:
- You can use graph paper as a two-dimensional ruler. Instead of placing the ruler on the object you can put the object on the paper.
- You can also use it to do the multi-digit math. Having multiple numbers in a small space can make it confusing to determine which numbers should be added, subtracted, multiplied, etc. Graph papers and keep those number neat and aligned.
- It can also be used as a writing aid, especially for children who have started learning how to write.
For example, you can use a three-block row where capital letters can take up the top two rows and lowercase letters should take up only the second row. While letters that dip under the line like the lowercase “p”, “g”, and “y” can take up the bottom two rows. Also, a block can help children separate words which are helpful since children often have problems with spacing.
- You can fill in circles in black or color to create graph art.
- You can use it to create crossword puzzles.
- You can use it to create a maze.
- You can use it to play the dot game with dots, this works when the grid lines are very light, it also helps if the grids are large.
Formats
- Quad paper sometimes referred to as quadrille paper from French quadrillé, ‘small square’, is a common form of graph paper with a grid printed in light blue or gray. In the U.S. and Canada, it often has two, four or five squares to the inch for work that does not need too much detailing whereas metric paper with similar grid typically has one or two squares per centimeter.
- Engineering paperis traditionally printed on light green or on translucent paper with four, five or ten squares per inch. The grid lines are printed on the back side of each page and show through faintly to the front side with each page having an unprinted margin.
- Millimeter paper has ten squares per centimeter and is used for technical drawings.
- The hexagonal paper shows regular hexagons instead of squares. These can be used to map geometric tiled or tessellated designs among other uses.
- Isometric graph paper or 3D graph paper is a triangular graph paper which uses a series of three guidelines forming a 60° grid of small triangles. The triangles are arranged in groups of six to make hexagons. The name suggests the use for isometric views or pseudo-three-dimensional views. Among other functions, they can be used in the design of triangle point embroidery. It can be used to draw angles accurately.
- The logarithmic paper has rectangles drawn in varying widths corresponding to logarithmic scales for semi-log plots or log-log plots.
- Normal probability paper is another graph paper with rectangles of variable widths. It is designed so that “the graph of the normal distribution function is represented on it by a straight line”, i.e. it can be used for a normal probability plot.
- The polar coordinate paper has concentric circles divided into small arcs or ‘pie wedges’ to allow plotting in polar coordinates.
In general, graphs showing grids are sometimes called Cartesian graphs because the square can be used to map measurements onto a Cartesian (x vs. y) coordinate system. It is also available without lines but with dots at the positions where the lines would intersect.
Important Ingredients of a Good printable Graph paper and Grid Paper
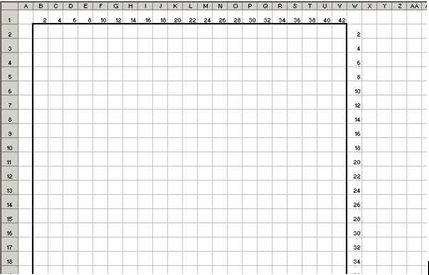
It’s an easy task to turn an Excel sheet into a modifiable piece of graph paper, all it requires is a little effort.The trick here is to square up the cells, the gauge is not a considerable factor here.
The hard part is getting the width and height settings to produce a square because there’s no easy way to match a cell’s height and width settings. You can’t just set the row height and column width to the same value because:
- Excel measures row height in points.
- Excel considers the current font when calculating column width; a column width of 5 means that the column will display 5 digits, using Normal style.
But there’s an easier way:
- First, you need to insert and format an Auto Shape,which you can use as a guide later, as follows:
- From the Drawing toolbar, choose Basic Shapes from the Auto Shapes drop-down list.
 2.Double-click the rectangle (the first shape in the first row) and Excel will insert a rectangle into the current sheet.
3.Right-click the rectangle and choose Format Auto Shape.
4.Click the Size tab.
5.In the Size And Rotate section, enter .25″ for both the Height and Width to create a square. If you want a larger square, enter a larger value for both measurements.
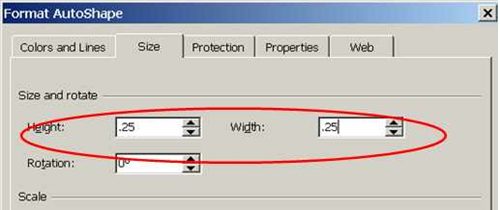
6.Click the Properties tab, select the Don’t Move Or Size With Cells option, and click OK.
7.Back in the sheet, move the rectangle (it’s a rectangle object, shaped as a square), to the top-left corner, just over cell A1.
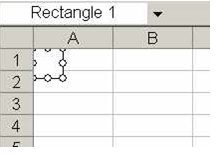
- Now, resize both the height and width by dragging the header and row cells to the appropriate position as follows:
- Select the entire worksheet (or the area you want to resemble graph paper). To select the entire sheet, click the sheet selector — that’s the cell that intersects the row and column headers (in the top-left corner).
- Hover the mouse over the right border of column A’s header cell.
- When the cursor turns into a double-arrow, drag the border until it’s flush with the rectangle’s right border. Excel will resize the width of all the selected columns, not just column A.
- To resize the height, adjust the bottom border of row 1 until it’s flush with the bottom of the rectangle. Again, Excel will adjust all the selected rows.
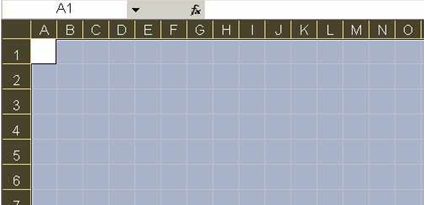
5. At this point, you will be left with a sheet full of .25-inch cells. Now you can move the Auto Shape rectangle at cell A1 or delete it as its purpose is over.If you feel that the cells are still a bit too large, set the Zoom property to 50%.Then, start adding the appropriate components by formatting cells and adding Auto Shapes, while doing this be sure to add a legend to identify all those components.
